

Container marine market: Invisible overcapacity rising to the surface, why 2027 maybe next inflection point? |
|
| Tina Kong | |
| Insight | Time: Sep 9 2026 2:55PM | |
As of 4 September, the Shanghai Containerized Freight Index (SCFI) rose for the sixth consecutive week, gaining80.52 points to settle at 3,590.05 – a weekly increase of 2.29%. The North American trades remained the primary driver, with both USWC and USEC rates moving higher, while Southeast Asian routes posted a notable 12% weekly jump amid port congestion in parts of Asia.
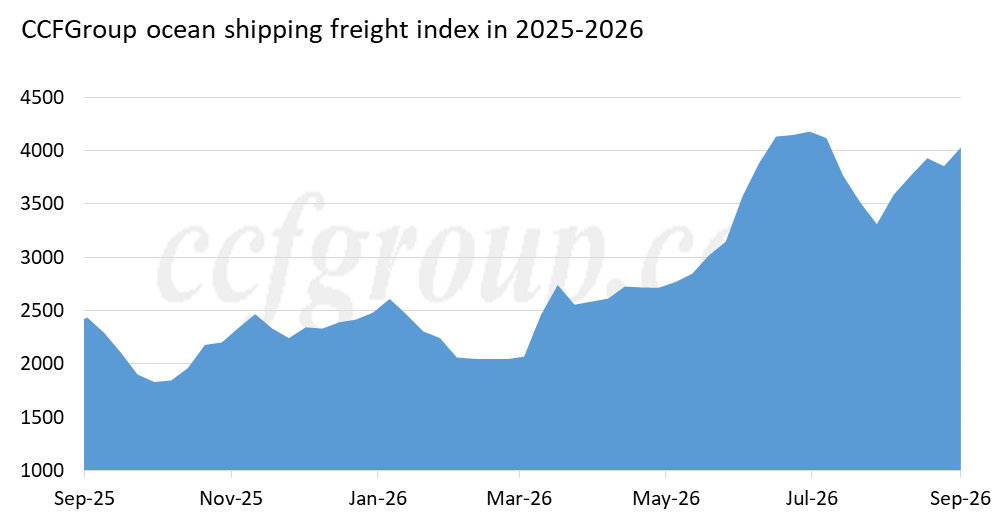
According to the data collected by the CCFGroup, the freight from Ningbo to Egypt/SOK was at US$9000/40HQ, that to Indonesia/Jakarta was near US$2700/40HQ, that to Pakistan/Karachi was around US$3300/40HQ, and that to Bangladesh/Chattogram was around US$4200/40HQ.
Remark: the freight of different ships and forwarders differs, and the above freight is only for reference.
The following is a brief summary of major routes performance:
Route |
Description |
Europe |
Transport demand remained broadly stable, while market freight rates continued to decline. |
North America |
Transport demand remained at elevated levels amid sound supply-demand fundamentals, pushing spot booking rate higher. |
South America |
Steady growth in transport demand continued to drive market freight rates upward. |
Australia-New Zealand |
Transport demand remained robust, with solid supply-demand fundamentals sustaining the upward trend in spot freight rate. |
Middle East |
Following a sustained rally to elevated levels, market sentiment toward cargo bookings cooled, prompting a correction in freight rate. |
However, this apparent strength masked a more fragile reality. Three temporary factors are currently absorbing a significant portion of global capacity: first, Red Sea diversions (approx. 4. million TEU still routing via the Cape of Good Hope); second, port congestion (approx. 3.92 million TEU trapped at anchorages globally); third, temporary delivery lull (August newbuilding deliveries hit a 3-year low of just 64,640 TEU).
The core warning: Once these three buffers fade – and a record 14.84 million TEU orderbook continues to deliver – the market could face a simultaneous supply surge, most critically around March 2027, the traditional post-Chinese New Year demand trough.
The return of Suez Canal transits is no longer a hypothetical scenario – it is already underway.
*Current status: Approximately 19% of Asia–Europe capacity has already resumed Suez routing, with CMA CGM, Maersk, and MSC all restoring selected services.
*Capacity shift: At the peak of the Red Sea crisis, about 380 vessels / 5.5 million TEU were diverted via the Cape. Today, that number has dropped to approximately 280 vessels / 4.0 million TEU – a reduction of 1.5 million TEU in diverted capacity.
*Economic logic: Longer Cape routes mean higher fuel consumption and operating costs. Provided security conditions allow, a full return to Suez is the most rational commercial outcome, according to Sea-Intelligence.
Key takeaway: Every vessel that switches back from the Cape to Suez effectively shortens its voyage by 7–10 days, releasing latent capacity back into the market.
Global port congestion remains near record levels, but this too is a reversible shock.
Metric |
Current data |
Context |
Vessels waiting at anchor (global) |
3.92million TEU |
Equivalent to11.4%of the global fleet |
Peak delay (Ningbo/Shanghai, typhoon-affected) |
> 10 days |
Temporary weather disruption |
Tema Port (Ghana) – waiting time increase |
7 days (Jan) → 40+ days (Aug) |
Severe inland congestion; demurrage costs estimated at $45–50 million for Jan–Aug |
What this means today:The large nominal fleet is not fully "effective" – which explains why vessel supply feels tight and charter rates remain firm despite record global capacity.
What this means tomorrow:Congestion is not a permanent sink. As ports clear – and they eventually will – this 3.92 million TEU will return to active service, adding measurable supply pressure.
Such movie has apppeared before. In 2023, post-pandemic congestion unwound rapidly, releasing previously absorbed capacity and reversing the supply-demand balance within months.
August's low delivery volume (64,640 TEU) is a statistical anomaly, not a trend.
*Global orderbook: 14.84 million TEU – equivalent to 43.1% of the existing fleet.
*New orders continue: COSCO recently added 18 vessels / ~280,000 TEU, including 12 units of 22,000 TEU. Its total orderbook now stands at 1.89 million TEU – 52% of its current fleet.
*BIMCO milestone: Global container capacity is about to breach 34 million TEU – a level reached in just 5.5 years from 24 million TEU, compared to the previous 10.5 years it took to grow from 14 million to 24 million TEU.
Capacity breakdown (BIMCO data):
*Vessels >12,000 TEU contributed ~two-thirds of the new capacity;
*Average vessel size increased by 14% ;
*Approximately 2,000 vessels (>5 million TEU) are now 20+ years old – but scrappage remains extremely low (<300,000 TEU over the past 5.5 years).
Implication: Even without a demand shock, the supply-side arithmetic is daunting. If scrappage does not accelerate meaningfully, BIMCO projects the global fleet could reach 44 million TEU within five years.
The most critical question is timing. Why focus on 2027, especially March–April?
Because by then, the three temporary supply-absorbers could unwind simultaneously:
Force |
Current effect |
Potential release (2027) |
Red Sea diversions |
Absorbs ~1.5M TEU (vs peak) |
Full Suez return → shorter voyages → capacity release |
Port congestion |
Absorbs ~3.92M TEU |
Normalisation → vessels re-enter active pool |
Newbuilding deliveries |
64k TEU (Aug low) → orderbook of 14.84M TEU |
Peak delivery wave hits the water |
The fourth force – seasonal demand: March is the traditional post-CNY lull. If capacity surges coincide with a demand trough, the combined effect on freight rates could be materially sharper than any single factor would suggest.
Risk scenario:Demand softens seasonally, while supply increases from three directions simultaneously. That is the convergence event worth preparing for.
Immediate actions:
*Several carriers have already announced blank sailings and port omissions for late September to early October, aiming to stabilise rates after the Golden Week holiday.
*The current SCFI six-week rally is likely to lose steam as pre-holiday front-loading peaks and fades.
Medium-term watchlist:
* Red Sea / Suez resumption pace – any major announcement from the 2M or Ocean Alliance could accelerate the timeline.
* Newbuilding delivery schedule – 2027 delivery slots are filling fast; monitor shipyard output closely.
* Port congestion evolution – particularly in Asian hubs (Ningbo, Shanghai, Singapore) and emerging bottlenecks like Tema.
* Scrappage rates – if older vessels start leaving the fleet in larger numbers, it could offset some new capacity.
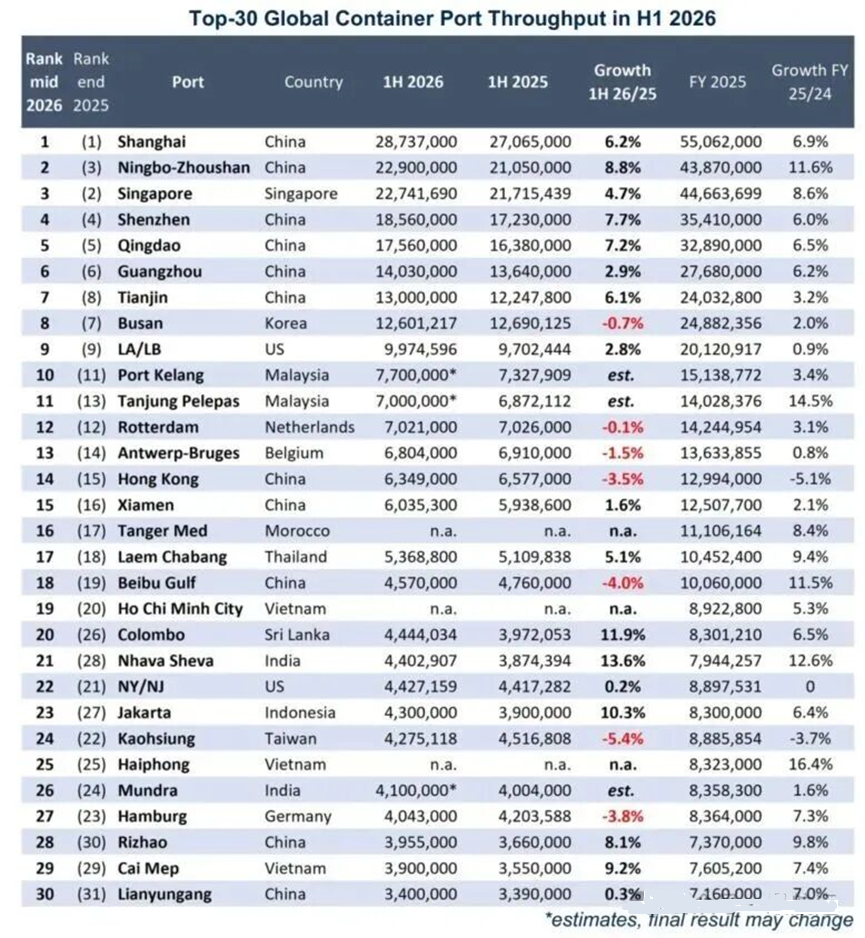
*Port rankings (H1 2026): Ningbo-Zhoushan overtook Singapore for the first time in a half-year comparison – 22.90M TEU vs 22.74M TEU, trailing only Shanghai (28.74M TEU). This reflects China's manufacturing export strength, though Singapore retains its edge in transshipment and shipping services.
*Panama Canal: Daily transit slots reduced from 36 → 34 (3 Sep) and further to 32 (15 Sep) , with draft reduced to 14.63m. Rainfall in the catchment area is 34% below historical averages. Some US LNG carriers are already opting for the Cape route, adding ~20 days to voyage times.
*DHL acquisition: DHL Global Forwarding acquired Uruguay's Aero Cargas S.A. to strengthen its Latin American footprint, citing geopolitical fragility in traditional trade lanes.
* CMA CGM – China JV: Signed an MoU with CCCC to cooperate on port infrastructure, logistics, decarbonisation, and alternative fuel projects – aligned with its 2050 net-zero target.
*H1 2026 performance of major shipping and logistics companies: More details can be found from Brief analysis of H1 2026 performance of major shipping and logistics companies
The current market strength is real, but it is largely borrowed from temporary disruptions. The underlying supply overhang, masked by diversions and congestion, will not remain hidden forever.
Near-term US-bound rates have capacity support, but fading typhoon impacts and the approaching off-season may weigh on them. The medium-term outlook hinges on two factors: Middle East geopolitics (Red Sea/Suez reopening) and new vessel deliveries. A de-escalation and resumed Red Sea transits would boost effective capacity, posing significant downside risk. Overall, while supply chain disruptions persist, rates are likely to stay above historical averages, albeit with greater volatility.
For international shippers and logistics buyers, the key strategic takeaway is not to extrapolate today's rates into long-term procurement decisions. Instead, 2027, particularly Q1, deserves close attention as a potential turning point where multiple supply-side forces converge.