
• Home
    • News Insight Snapshot Morning express Daily Weekly Operation report Monthly
    • Market price Database Annual report Researchpremium Focuspremium Mobile Apppremium      
  • Data & API Services
  • Consulting
  • Industry Conference
  • Company Profile Contact Us Website Guide
  • FAQ
  •     
7-day free trial Login
  • Chemicals
    Benzene Styrene Toluene Xylene Methanol DEG PP PE
  • Polyester
    PX/PTA MEG PET fiber chip PET bottle chip PFY PSF
  • Recycled fiber
    PET Flakes Re-PSF Re-PFY
  • Nylon
    CPL/PA6 AA/PA66 Nylon Fiber
  • Spandex
    PTMEG/MDI Spandex
  • Acrylic
    Acrylonitrile Acrylic Fiber
  • Cellulose
    Cotton linter/refined cotton Pulp VSF VFY Rayon yarn
  • Cotton
  • Spun Yarn
  • Textiles
  • Researchpremium
  • Focuspremium
×

China's spunlace nonwovens exports to the US post a notable MoM decline in July 2026

Monica Jiang
Insight  |  Time: Aug 27 2026 3:01PM
China's Jan-Jul 2026 spunlace nonwovens exports rose 6% YoY. Jul export volume stayed flat YoY but dropped 11% MoM, while export value increased 14% YoY, signaling higher average prices. Exports to the top five markets grew YoY in Jul yet mostly fell MoM, with US exports down sharply.

I. Spunlace nonwovens exports slightly increase in Jan-Jul, 2026

According to customs data, China's exports of spunlace non-woven fabric reached 37,678 tons in Jul 2026, roughly flat year-on-year (YoY) and down 11% month-on-month (MoM). Export value stood at $92.6 million, rising 14% YoY and falling 8% MoM. The cumulative export volume from Jan to Jul hit 274,336 tons, a 6% YoY increase.
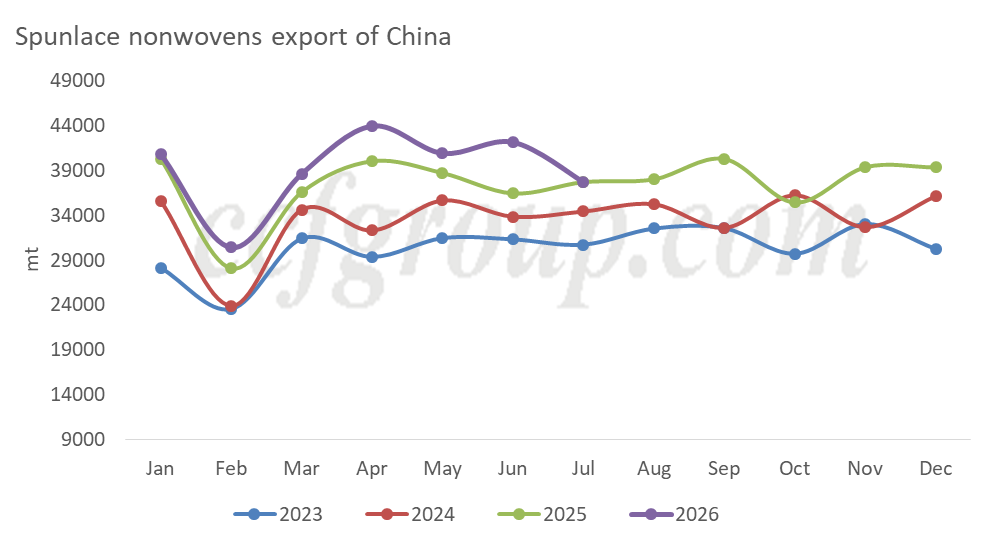

Line chart of China monthly spunlace nonwovens export volume (metric tons), 2023?2026 historical export trend graph


II. Jul exports to the five key countries mostly grow YoY but drop MoM

In Jul 2026, exports to the top five destinations (South Korea, the United States, Japan, Vietnam and Brazil) totaled 19,207 tons, up 9% YoY and accounting for 51% of total exports (a 4-percentage-point YoY rise). Cumulative exports to these five markets over Jan-Jul reached 139,101 tons, climbing 8% YoY. For Jul, exports to these five markets generally posted YoY gains, while most recorded MoM declines. Exports to the United States saw a sharp MoM drop of 37%.
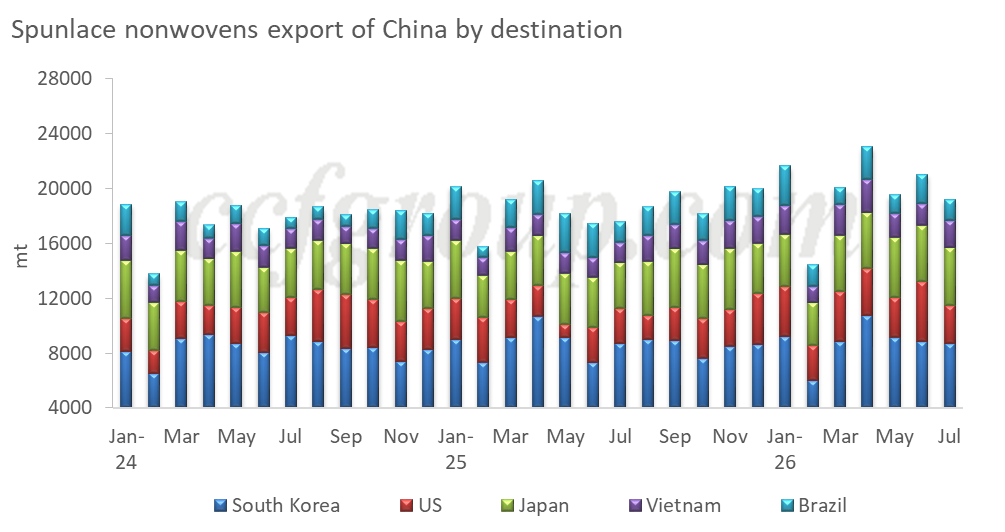

Stacked bar chart: China spunlace nonwovens export volume by destination country, monthly breakdown to South Korea, US, Japan, Vietnam, Brazil, 2024?2026


III. Fujian registers the highest growth rate on a MoM basis

Major origins (Zhejiang, Shandong, Jiangsu, Guangdong and Fujian) recorded combined exports of 31,128 tons in Jul 2026, down 3% YoY and representing 83% of the national total. By province, Shandong and Guangdong fell by 32% and 18% YoY respectively, while other regions registered YoY growth ranging from 2% to 36%. On a MoM basis, only Fujian achieved a 20% rise in exports, with all other regions reporting MoM decreases between 3% and 25%.
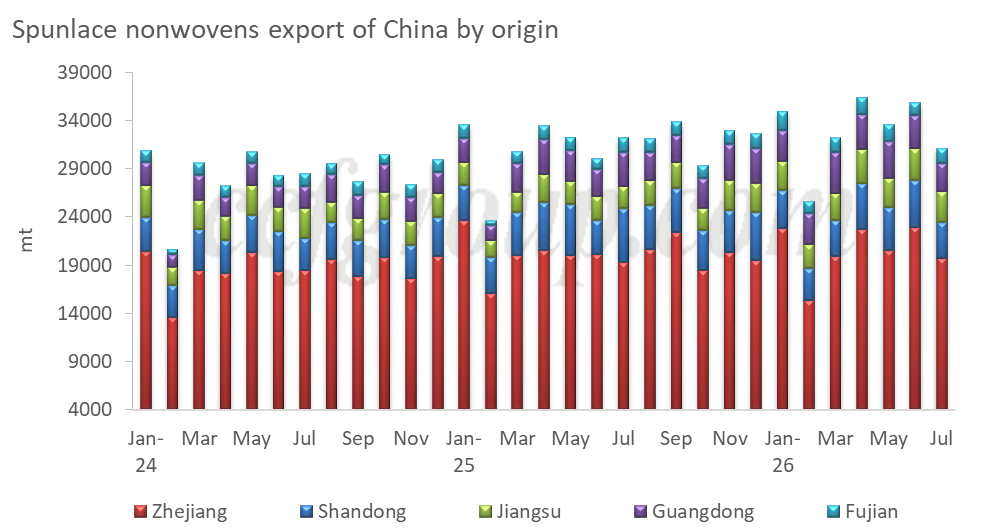

Stacked bar chart: China spunlace nonwovens monthly export volume by origin province, Zhejiang, Shandong, Jiangsu, Guangdong, Fujian, 2024?2026


IV. Summary

In Jul, spunlace non-woven fabric exports were roughly flat YoY with a notable MoM decline. The average export price rebounded markedly, rising 14% YoY. By destinations, exports to the five key markets generally delivered YoY growth, outperforming the flat overall export volume. This indicates widespread volume declines for exports to smaller and scattered markets. By origins, export performance diverged sharply among the five major producing areas, with Shandong and Guangdong suffering substantial YoY falls in export volumes.

[RISK DISCLAIMER] All opinions, news, analysis, prices or other information contained on this report is provided by analyst of Zhejiang Huarui Information Consulting Co., Ltd (CCFGroup) as general market commentary and does not constitute investment advice. CCFGroup will not accept liability for any loss or damage, including without limitation to, any loss of profit, which may arise directly or indirectly from use of or reliance on such information.

Related Articles

    Rayon yarn market morning express (Nov 20, 2026)
    Dissolving pulp import of China increases in Oct 2026
    Exports under 550490 exceed 20kt for the first time
    Refined cotton trading lukewarm recently
    Cotton linter market softens with minor price swings
    Viscose staple fiber market morning express (Nov 20, 2026)

Researchpremium

    Substitution dynamics between virgin and recycled cotton-type PSF
    Operating performance of listed Chinese textile and apparel enterprises in H1 2026
    2025/26 Chinese cotton market fundamental analysis and outlook
    Operation analysis of China's lyocell and rayon printed & dyed fabrics
    Cotton yarn market: H1 review and H2 outlook
    Analysis of polyester demand in H1 2026 and H2 outlook
  • Address
    Huarui Center No. 1027 Jianshe 1st Road,
    Hangzhou, Zhejiang Province, China
  • Phone
    +86-571-8378 6653    +86-571-8378 6504
  • Email
    market@ccfgroup.com
Our Service
  • Home
  • Market price
  • Database
  • Research
  • Focus
  • Website Guide
  • Data & API services
  • Consulting
  • Industry conference
  • Company profile
  • Mobile app
  • FAQ
About Us


A leading provider of market intelligence, data services, and industry insights across the petrochemical, chemical fiber, and textile value chains.

© Huarui Information All Rights Reserved   Privacy Policy · Terms of Use

China ICP License: 浙B2-20110322-3
浙公网安备33010902000742号