

China's PP imports rebound slowly, exports continue to slide in July |
|
| Amber | |
| Insight | Time: Aug 26 2026 10:18AM | |
According to China Customs data, China's PP imports in July 2026 totaled approximately 200.1kt, down 29.15% year-on-year. Of all imports, homo PP imports accounted for 138.4kt, down 21.89% year-on-year; co PP imports accounted for 54.9kt, down 42.36% year-on-year; and ra PP imports accounted for 6.8kt, down 19.45% year-on-year. China's PP exports in July 2026 totaled approximately 337.1kt, up 27.90% year-on-year. Of all exports, homo PP exports accounted for 295.0kt, up 24.97% year-on-year.
PP import & export in Jul |
|||||
Products |
homo PP |
co PP |
ra PP |
total |
|
HS Code |
39021000 |
39023010 |
39023090 |
||
import |
quantity(kt) |
138.4 |
54.9 |
6.8 |
200.1 |
y-o-y change |
-21.89% |
-42.36% |
-32.04% |
-29.15% |
|
m-o-m change |
24.94% |
2.06% |
-19.45% |
15.66% |
|
export |
quantity(kt) |
295 |
36.1 |
6 |
337.1 |
y-o-y change |
24.97% |
59.25% |
23.99% |
27.90% |
|
m-o-m change |
-18.32% |
-28.94% |
-14.99% |
-19.55% |
|
net import |
quantity(kt) |
-156.6 |
18.8 |
0.8 |
-137 |
y-o-y change |
/ |
/ |
/ |
/ |
|
m-o-m change |
/ |
/ |
/ |
/ |
|
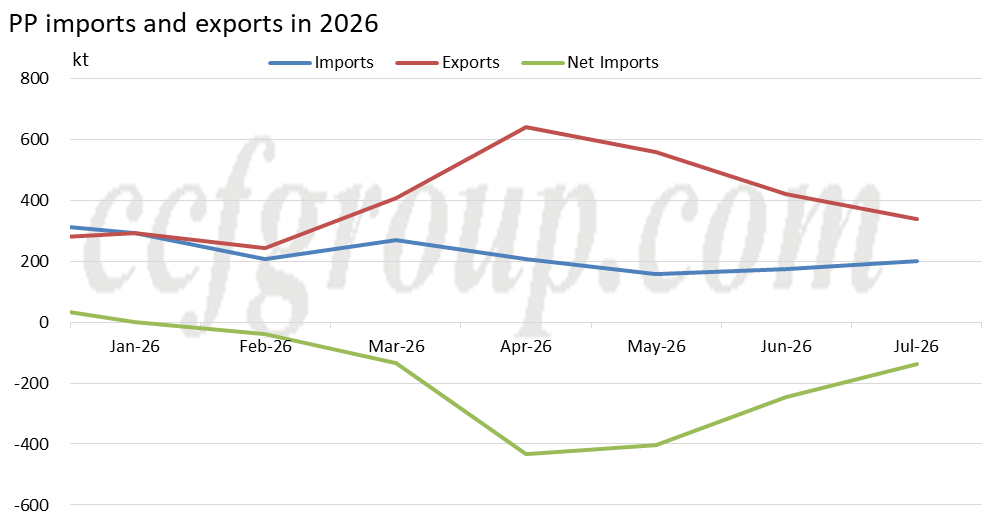
In 2026, PP imports have rebounded for two consecutive months after hitting a new low in May, while PP exports have declined for three consecutive months after peaking in April. In absolute terms, the import recovery has been relatively slow, while the export decline has been more pronounced, with monthly declines exceeding 80kt for three straight months and reaching as high as 140kt in June.
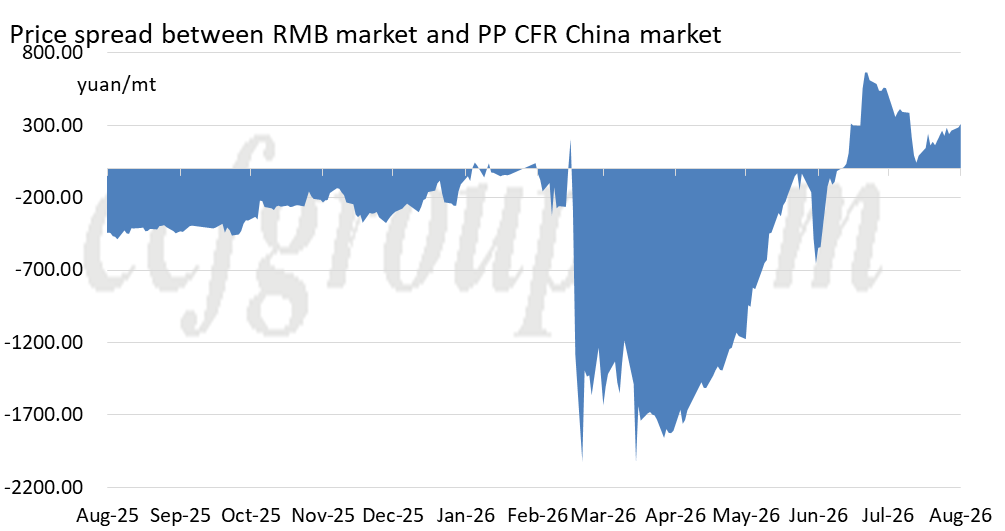
This shift in import and export trends can be attributed to two factors. On one hand, it relates to the narrowing price spread between domestic and overseas markets. Since May, the spread has continued to shrink, gradually eroding the export advantage. From July onward, domestic prices have even exceeded overseas prices, effectively closing the export arbitrage window. On the other hand, the blockade of the Strait of Hormuz has driven up ocean freight and insurance premiums, further increasing export costs and discouraging some exporters.
Homo PP exports by trading partner |
|||||||
Ranking |
Trading partner |
Export volume (kg) |
Trade value (USD) |
Average export price ($/mt) |
Volume Change (kg) |
Change rate |
Ranking change |
1 |
India |
60191237 |
66210283 |
1100 |
29629496 |
96.95% |
2 |
2 |
Vietnam |
34485863 |
44484219 |
1290 |
-14315357 |
-29.33% |
-1 |
3 |
Indonesia |
16968560 |
20612079 |
1215 |
-15923252 |
-48.41% |
-1 |
4 |
Peru |
16097928 |
19519331 |
1213 |
5689228 |
54.66% |
6 |
5 |
Thailand |
14626551 |
19438388 |
1329 |
-7838447 |
-34.89% |
-1 |
6 |
Philippines |
12195297 |
13819386 |
1133 |
652710 |
5.65% |
3 |
7 |
Bangladesh |
12132208 |
13494854 |
1112 |
-5704682 |
-31.98% |
0 |
8 |
Nigeria |
11251459 |
13209202 |
1174 |
2835748 |
33.70% |
3 |
9 |
Malaysia |
9961774 |
12924743 |
1297 |
-2695540 |
-21.30% |
-1 |
10 |
Brazil |
9317592 |
12092973 |
1298 |
-10395708 |
-52.73% |
-4 |
11 |
Pakistan |
7244410 |
8745375 |
1207 |
-12950182 |
-64.13% |
-6 |
12 |
Kenya |
6968994 |
8219930 |
1180 |
-403727 |
-5.48% |
0 |
Others |
83603478 |
109747831 |
1313 |
-34748566 |
-29.36% |
0 |
|
Total |
295045351 |
362518594 |
1229 |
-66168279 |
-18.32% |
||
As mentioned above, the July import recovery was sluggish, with an increase of only about 27.1kt, and the change was primarily in homo PP, which rose by about 27.6kt. By contrast, exports fell more sharply, down about 81.9kt, with the main change also in homo PP, which decreased by about 66.2kt, followed by co PP, down about 14.7kt.
In terms of the share of homo PP exports, the top destinations remained largely the same, though rankings shifted, with notable divergence in trends. Exports to Indonesia, Vietnam, Pakistan, and Brazil all saw significant declines, down by 15.9kt (48.41%), 14.3kt (29.33%), 12.9kt (64.13%), and 10.3kt (52.73%), respectively. On the other hand, some destinations saw growth, with India posting the most pronounced increase of about 29.6kt, nearly doubling from the previous month. These shifts in export volumes also reveal some patterns of export diversion.
Overall, with the domestic spot price advantage no longer in place and the export arbitrage window largely closed, the downward trend in exports is likely to continue. Meanwhile, while imports are expected to pick up, the scale of increase is not likely to be significant at this stage-growth is expected to be gradual, with even the possibility of a further decline.