

PX market review for H1 2026 |
|
| Louis | |
| Insight | Time: Aug 17 2026 3:07PM | |
Driven by the outbreak of the U.S.-Iran conflict since late February, PX price volatility has been more acute than in previous years, with the overall price range first surging rapidly, then oscillating at highs, and finally pulling back.
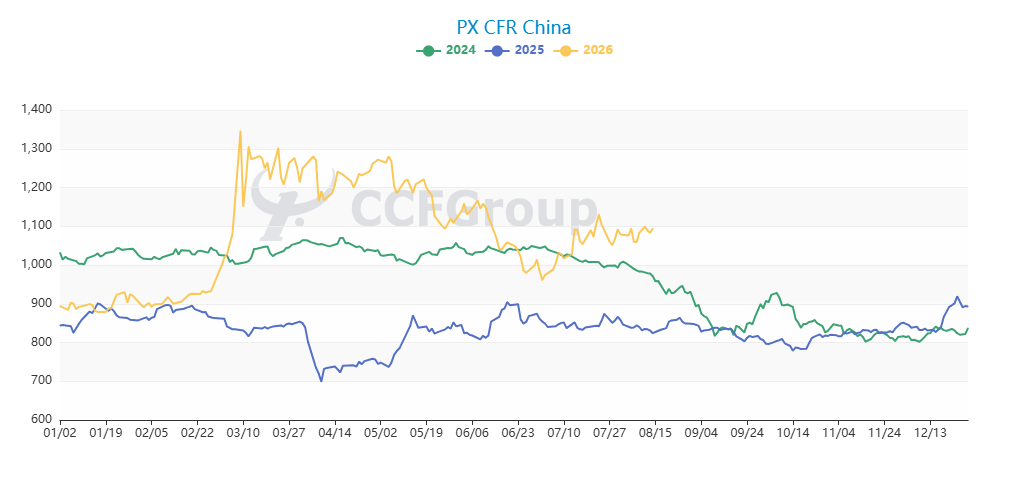
In terms of average prices, from January to June 2026, PX averaged $1,085/mt CFR China, up 30.06% year-on-year. It recorded high point of $1,346/mt on March 9, and the lowest at $879/mt on January 19.
On the upstream cost side, over the same period, WTI crude averaged $82.35/bbl, up 21.9% year-on-year, and Brent crude averaged $87.38/bbl, up 33.1% year-on-year. Naphtha prices averaged $806.6/mt CFR Japan in the first half, up 30.7% year-on-year.
The price trends over the first half year was driven by the U.S.-Iran conflict, which then transmitted downward along the entire petrochemical chain.
PXN spread moved in a wide range in the first half of 2026. In Q1, it declined slowly, averaging $284/mt, up 6.8% quarter-on-quarter and surging 39.9% year-on-year.
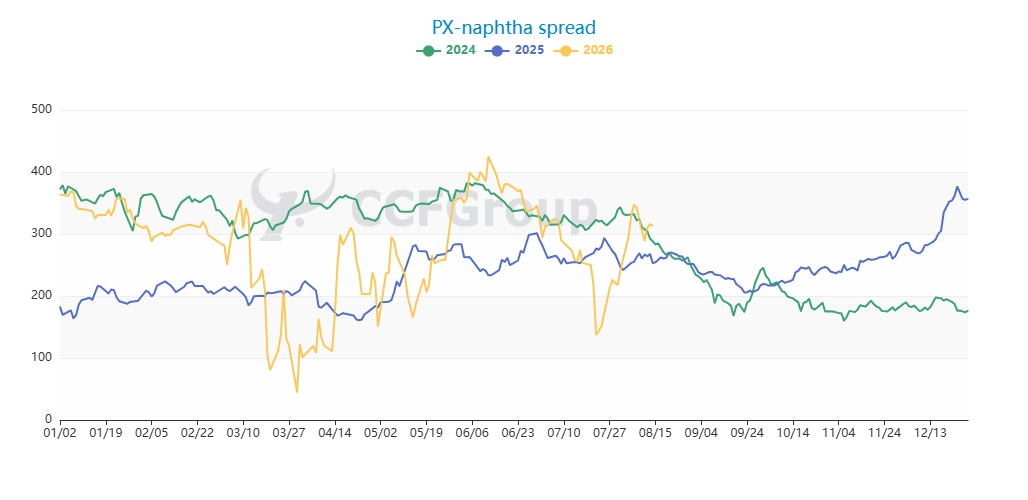
In late May, as naphtha weakened, PXN spread widened. The US-Iran situation eased, transits through the Strait of Hormuz improved, disruptions to Middle Eastern supply alleviated, and some Middle Eastern cargoes flowed out. In addition, earlier wide price spreads between Asia-US and Asia-Middle East attracted US and European naphtha to Asia. Supplies from the UAE and Russia increased, and Asia's light crude processing rose, boosting naphtha output.
On the demand side, poor olefin economics suppressed cracker operating rates, keeping naphtha demand low. Asian gasoline consumption was curbed by high prices, while potential Middle East supply recovery and limited Chinese exports also weighed on naphtha demand. As supply-demand tensions eased, naphtha margins compressed sharply.
However, PX was supported by strong demand from PTA's healthy margins, so the decline in PX was relatively limited, widening PXN spread to a peak of $425/mt on June 12. The spread averaged $272/mt in Q2, down 4.2% quarter-on-quarter and down 17.2% year-on-year.
For January-June 2026, PXN spread averaged $278/mt, up 27.8% year-on-year.
The PX-MX spread (on FOB Korea basis) moved in a wide range in H1 2026, averaging $134/mt, up 24.3% year-on-year. The spread was driven by the interplay between MX's blending demand and demand for MX from PX sector, alongside crude oil cost fluctuations and changes in the Asia-US intercontinental arbitrage window:
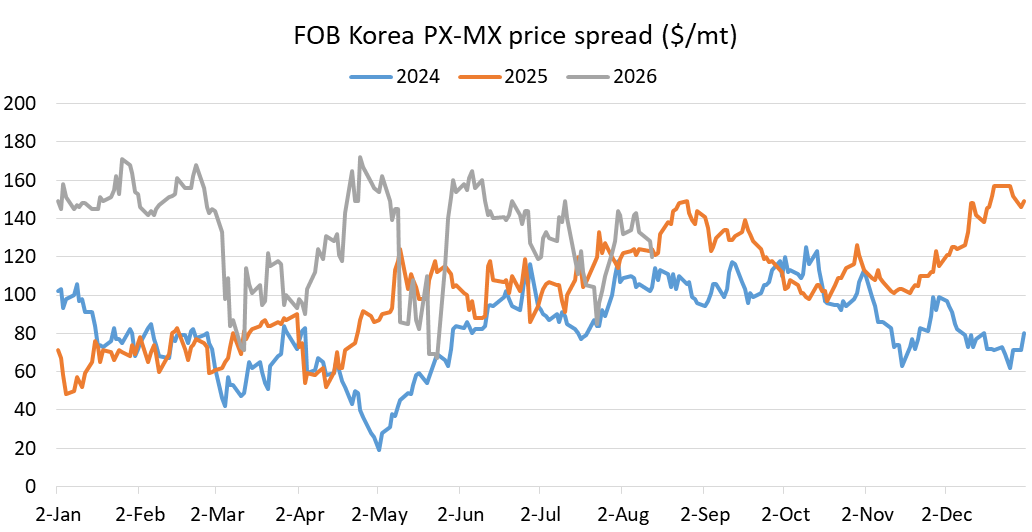
In January-February, PX prices rose steadily, while South Korea saw no MX arbitrage flows to the US and MX prices were under pressure, thus maintaining a high PX-MX spread.
In March, Middle East crude supply disruptions sharply boosted gasoline blending margins. More MX flowed into gasoline blending, tightening chemical supply and lifting MX prices, which quickly narrowed the PX-MX spread.
In early April, crude prices fell rapidly, from $112.95/bbl on April 7 to $83.85/bbl on April 17, a 25.8% drop, while PX, supported by its own supply-demand fundamentals, fell only 8.9% from its peak of $1,280/mt to $1,165/mt. This divergence in declines pushed the PX-MX spread wider.
In early-to-mid-May, easing US-Iran tensions sent crude prices lower, dragging PX down accordingly. However, MX prices held relatively firm on summer blending season demand, further narrowing the spread.
From late May onward, the Asian MX market faced pressure from two fronts. Firstly, crude weakened amid US-Iran talks and the reopening of the Strait of Hormuz, reducing cost support. Secondly, MX supply-demand imbalances intensified as Asian refiners ramped up runs after feedstock supply recovered, increasing MX supply, while blending demand was lackluster and arbitrage flows to the US were moderate. Meanwhile, China's extensive PX maintenance in July reduced MX procurement, weighing heavily on MX prices. As a result, the PX-MX spread widened significantly.
Overall, crude oil remains the core driver to PX and MX price trends. However, changes in PX supply-demand fundamentals and the shifting allocation of MX between blending and chemical use create divergent price movements, ultimately driving periodic fluctuations in the PX-MX spread.
In terms of PX plant operating rate, it dropped sharply from its year-to-date high of 92.4% (February 27) to 64.1% (June 30) in China, with further declines in July.
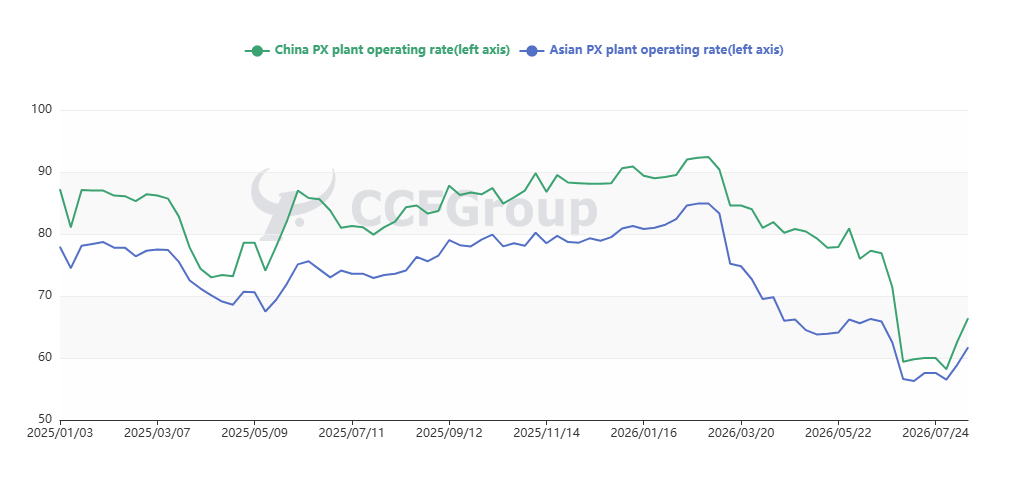
In H1, operating rate rose steadily in Q1. Starting from the end of Q1, however, PX rate gradually declined due to crude supply disruptions and scheduled maintenance turnarounds. Since non-China Asian countries are more dependent on Middle Eastern crude, their operating rates fell more sharply than China's after the supply disruption.
From January to June, China's average PX operating rate was 84%, up 2.4 percentage points year-on-year, while Asia's average operating rate was 73.2%, down 1.2 percentage points year-on-year.
China's total PX imports in January-June 2026 amounted to 4.501 million tons, little changed year-on-year, data from China Customs show.
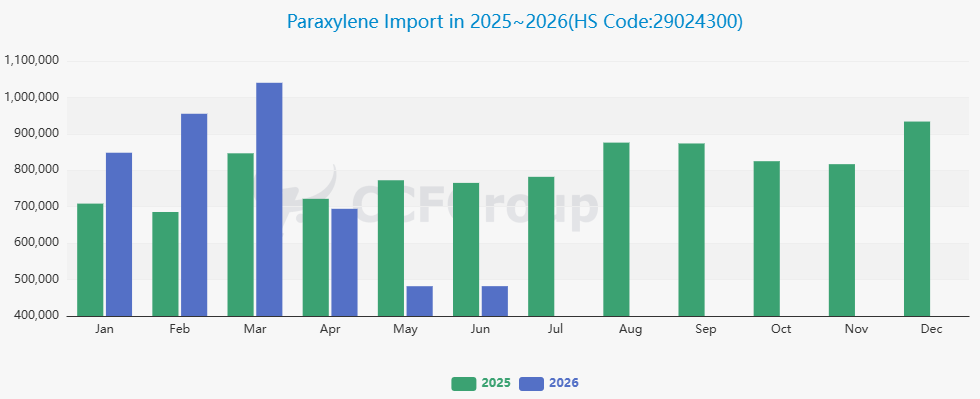
Unit: tons
In Q1, better processing margins drove PX plants both in China and abroad to ramp up production, steadily boosting overall PX output. Entering Q2, however, market dynamics shifted. First, the crude supply disruption forced PX plants to cut operating rates and reduce output. Second, as summer approached and blending demand picked up, refiners prioritized PX for captive use, weakening their export appetite. At the same time, better margins in other overseas markets diverted some PX cargoes that would otherwise have flowed to China.
In the first half of 2026, China domestic PX plant maintenance was concentrated, driving overall PX output downward. From January to March, monthly output remained in the 3180~3390kt range, then fell further from April to June due to multiple unit turnarounds, dropping to 2890kt in June.
Imports showed a clear divergence. Monthly imports were decent in Q1, reaching 955kt in February and 1040kt in March, but Q2 saw a sharp contraction, with imports falling to around 480~690kt per month from April to June. Although PTA plants also underwent concentrated maintenance in Q2, causing PX demand to decline from Q1 highs, the large downstream capacity base kept PX demand at a relatively high level.
PX inventories showed a destocking trend, with total stocks down nearly 110kt from January to June. February and May saw stock builds, with February in particular recording a significant accumulation due to concentrated supply release, with monthly supply-demand surplus of 350kt. But in January, March, April, and June, the inventories continued dropping, with June recording the largest drawdown of 270kt.
With China domestic unit maintenance constraining output, a sharp contraction in Q2 imports, and downstream demand still providing support despite maintenance, China domestic PX inventories trended downward overall, with fundamentals tightening marginally.